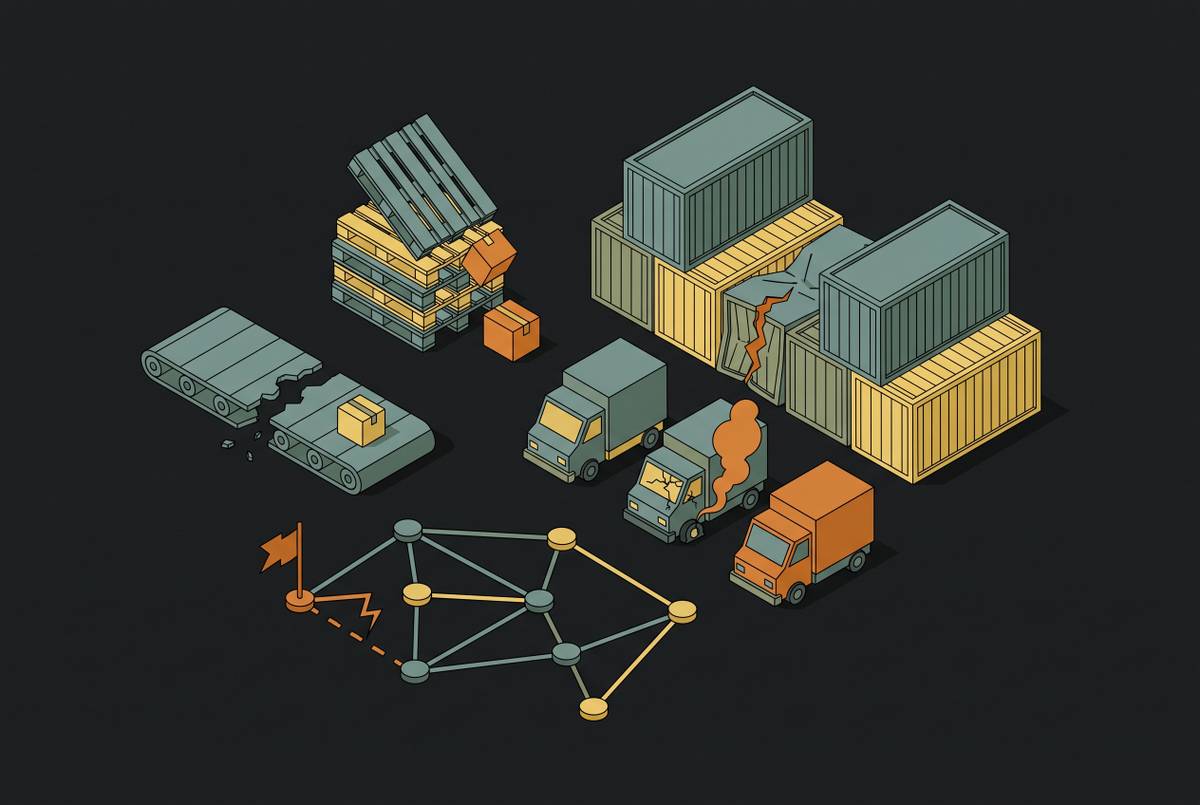
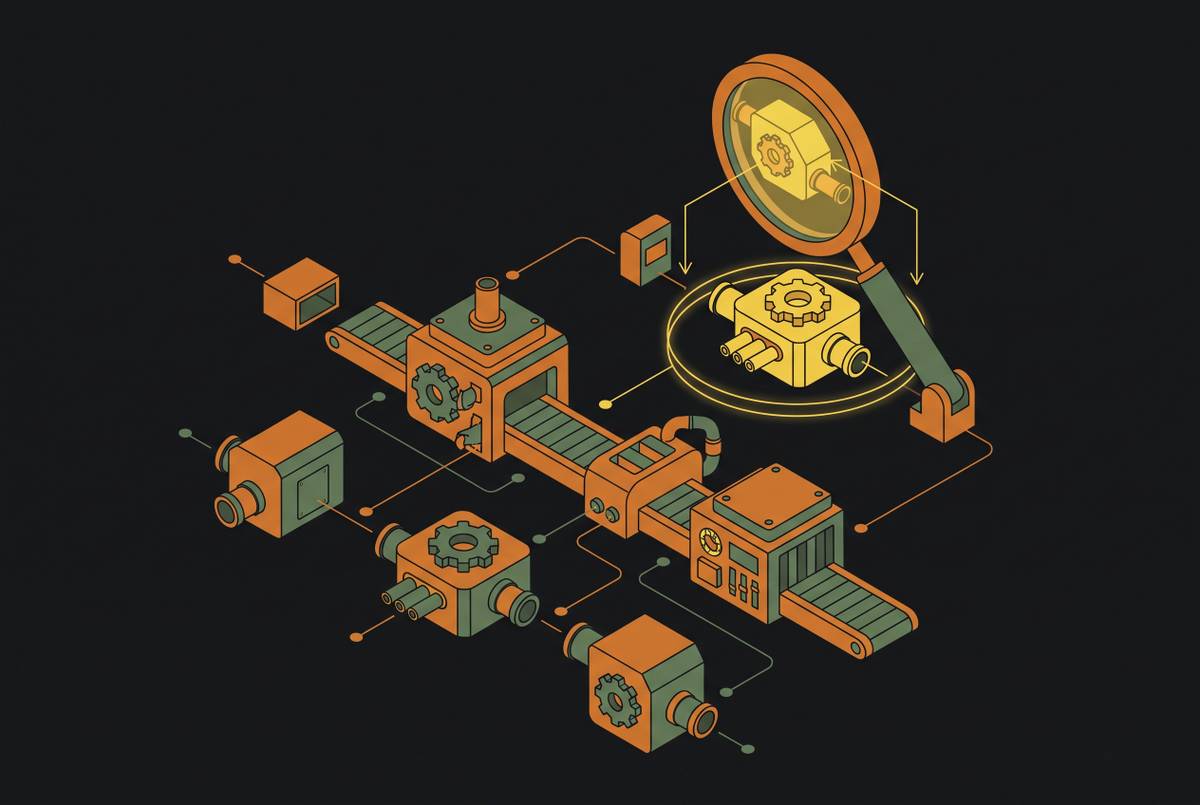
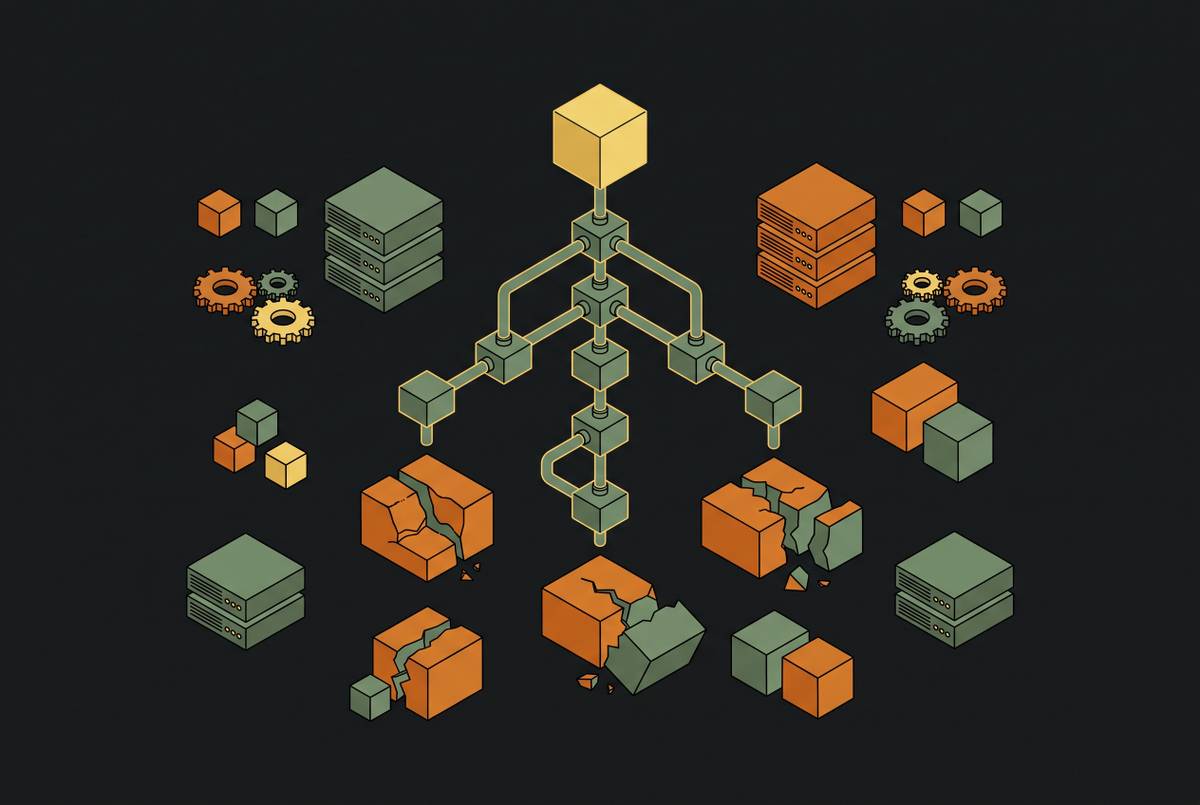
How Incentive Structures Drive Operational Risk Concealment
Rational incentives lead teams to hide operational problems until they surface as costly disputes.
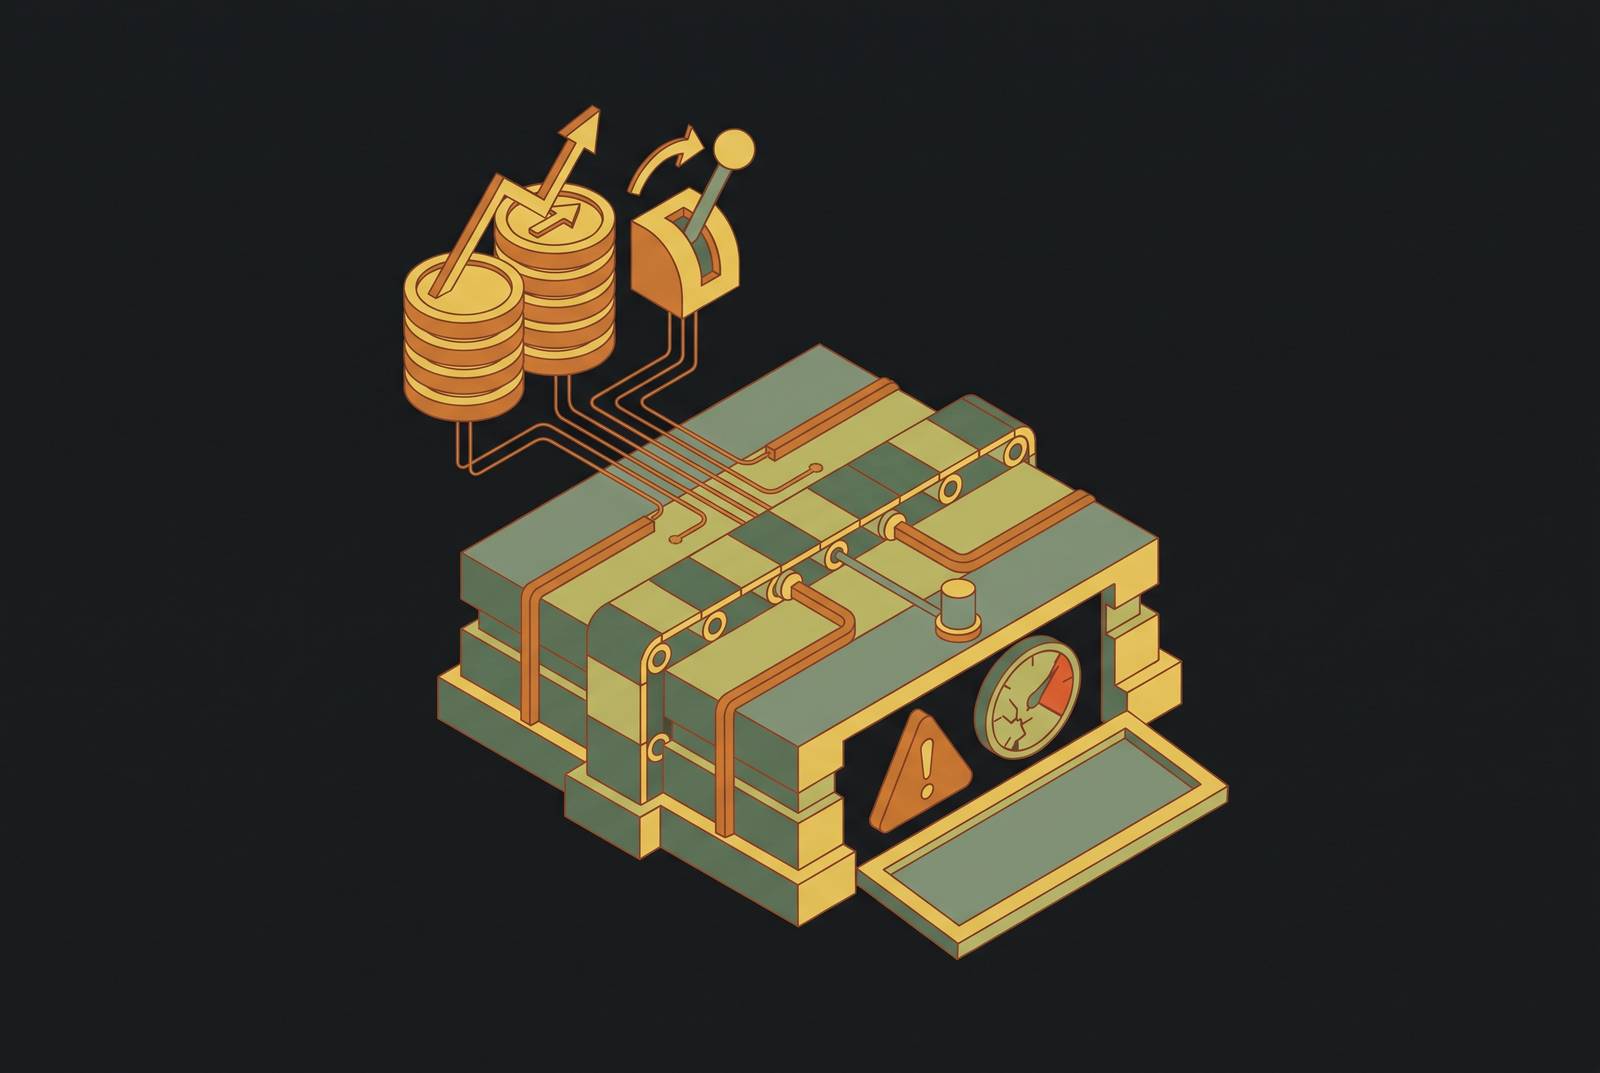
Operational risk concealment is the predictable result of incentives that make honest disclosure costly and optimistic reporting safe. From field updates to executive dashboards, those incentives widen the gap between declared status and operational reality. Closing that gap requires more than better reporting tools or appeals to transparency. It requires evidence outside the filtered reporting chain and processes that make early disclosure easier than silent absorption.
Why honest risk reporting is structurally penalized, not just culturally discouraged
Schedule adherence, milestone achievement, and budget variance are not neutral measures when they also determine how people are judged. Field crews, subcontractors, and department managers can face an immediate penalty for reporting a problem they cannot yet quantify, while absorbing it locally preserves their apparent performance. Silence becomes the safer individual choice. The project then loses visibility precisely when the people closest to the work first recognize an exposure.
The familiar cultural explanation is that “no one wants to be the bearer of bad news”. But that reluctance follows the reward structure. If acknowledging uncertainty creates a performance problem while projecting confidence avoids one, a request for greater openness leaves the underlying calculation unchanged. This does not require a coordinated effort to mislead. Rational decisions by individuals can produce an unreliable account of the project as a whole.
How the reporting chain converts field reality into dashboard optimism
The filtering begins with small choices about status. A field team marks an activity “in progress” rather than “delayed” because the latter triggers a variance report and a conversation it is not prepared to have. The project manager then reports “on track” because milestone achievement, rather than forecast accuracy, governs the performance review. At the next level, the executive summary shows green because the program director’s client relationship depends on projecting confidence. Each handoff removes some of the uncertainty that was visible below it.
No single adjustment has to look decisive. But taken together, these changes can leave the dashboard far from what is happening in the field before anyone thinks their own choice was dishonest. A problem still being absorbed locally may reach the executive level only as confidence in a future recovery. The reporting chain therefore does more than transmit information. It selects which parts of that information survive.
Mr Price Group’s 2025 ERM report distinguishes enterprise, tactical, operational, and specialist risks in its risk model. That separation addresses a basic visibility problem. A risk identified at one level is not automatically apparent at another, so a framework must deliberately connect those levels. Different layers need a way to surface exposures that ordinary upward reporting can filter out.
Schedule quality as the measurable signature of concealment
Schedule records give this filtering a measurable form. When teams absorb delay rather than disclose it, remaining activities can compress without explanation while the baseline remains unchanged. Compression without a corresponding scope reduction or resource surge is evidence of delay absorption. The schedule is banking on recovery. The schedule can still show the same completion date even as it becomes harder to believe the work can be done by then.
That distortion becomes clearer across successive updates than in a single current schedule. Baseline quality can deteriorate through execution as real conditions depart from planned ones, making the quality trend itself diagnostic. Critical-path shifts and the changes log help expose how that departure developed. A current status report can conceal the sequence. The historical record preserves the adjustments through which optimism was maintained.
Columbia Ventures used SmartPM to analyze historical schedules after delays surfaced in the final third of a project and liquidated damages came into play. The general contractor submitted a claim covering nearly the entire project duration. The analysis examined past updates, quality trends, critical-path shifts, and the changes log to distinguish legitimate delays from those that were not. The record supported a forensic reconstruction. It showed that the gap between declared status and field reality was recoverable from project evidence.
Procurement and energization risk as the most consistently hidden exposure
Long-lead procurement and grid interconnection can show the same skewed picture before construction starts. Developers and contractors can price work against declared start dates without checking equipment factory slots or grid readiness windows. Winning the bid rewards commitment. When those dependencies sit outside the traditional schedule and risk register, the project begins with a gap between its commercial promise and its operational readiness.
DPR’s Q3 2026 report gives lead times of roughly 40 weeks for generators and up to approximately 150 weeks for some transformers. These lead times constrain the critical-path and are central to planning the work. Yet when bid-stage risk registers leave them out, teams can keep trusting the schedule even though they have no equipment commitment to back it up. Permitting, county commissions, and interconnection queues introduce further exposure that is politically sensitive and difficult to quantify. The work still depends on these steps, even when their risk is hard to measure.
Prime terms flow into subcontracts by incorporation, while subcontracts add liquidated damages for energization and rack-readiness milestones that subcontractors cannot control. SB Energy’s SEC filing discloses uncapped liquidated damages provisions across a multi-billion-dollar construction program. That disclosure provides an important contrast to operational reporting. Legal obligations to investors force acknowledgment of financial exposure that optimistic readiness assumptions can leave outside project dashboards.
Workforce concentration risk: the gap between experiencing a problem and measuring it
Teams experience productivity losses through turnover, key-person dependency, and subcontractor coverage gaps without converting those losses into a quantified risk. Awareness is not the missing element here. The missing step is translating local knowledge into a figure that challenges the project’s labor assumptions. That step invites the same scrutiny that discourages early schedule disclosure.
Aon’s 2025 Global Risk Management Survey found that a significant share of respondents reported income loss from workforce shortage in the prior year, while only 8.1% had quantified that risk. The asymmetry exposes the measurement gap. Experiencing a loss does not automatically create an incentive to record the underlying exposure. In project reporting, quantification requires acknowledging that labor assumptions may be wrong, rather than treating each coverage problem as something the team will absorb. Workforce concentration can therefore remain outside the risk register even when its effects are already reducing productivity.
What happens when the concealment resolves: disputes, claims, and the financial shape of late disclosure
Hidden risk eventually changes its commercial form. An exposure that could have informed planning becomes a dispute over responsibility, compensation, or contractual damages. By then, the parties must reconstruct what happened as well as address its consequences. HKA’s CRUX Insight report, published in November 2025, found that on distressed major projects the average sum in dispute reaches a substantial fraction of the contract budget, while claimed time approaches or exceeds planned duration.
The Columbia Ventures case shows how late disclosure becomes adversarial. Once the delay surfaced as a claim, the owner and general contractor faced a forensic dispute over the schedule history. The same records that could reveal deterioration now served to distinguish competing claims. Liquidated damages added financial exposure to that argument. Disclosure at this stage involves establishing liability.
A weak or biased baseline can start this sequence at bid stage, long before a claim is filed. The SB Energy disclosure illustrates the financial stakes when readiness assumptions meet contractual triggers. Early disclosure and late disclosure are therefore not equivalent events separated only by time. Early disclosure provides a planning input while mitigation remains possible. Late disclosure adds claims, forensic analysis, and damages exposure to a problem that optimistic reporting has allowed to accumulate.
Why tooling deployed on top of a biased process inherits the bias
Real-time dashboards do not remove the incentives governing their inputs. If field updates have already been filtered, faster aggregation produces a more polished version of the same incomplete account. AI-assisted analysis faces a related constraint when historical data embeds optimistic baselines. Gaps in job-cost data, WIP reporting, and system integration compound that weakness by limiting the history available to the model.
The distinction is where technology enters the process. A reporting layer that consumes approved status inherits the choices made before approval, whereas integration with operational records can expose information those choices omit. DL E&C’s adoption of a data integration platform connects design, construction, and maintenance data to live project planning. Data from many sites, including costs, quality, and design, informs that planning. Work instructions generated during construction also populate planning records automatically.
That connection changes what future estimating can see. The integration makes past change orders and risk events visible when new projects are scoped, making it harder to isolate historical problems from future bids. The value lies in the connection between evidence and planning. Tooling helps when it exposes what the reporting chain suppresses.
Detecting the gap between declared status and operational reality without relying on self-reported data
For operations leaders, detection should begin with evidence that does not depend on the current status narrative. Schedule history provides one such record. The changes log, quality trend, and critical-path shifts show whether updates have absorbed delay by cutting the time left for work through unexplained compression. Checking those changes against assumptions about scope and resources shows whether the work can support the claimed recovery. The Columbia Ventures analysis demonstrates the value of examining successive schedule updates.
Equipment factory slots, interconnection queue positions, and grid operator readiness requirements can be compared with declared start dates and energization milestones. Permit records and interconnection filings add evidence about regulatory dependencies. SEC disclosures can expose contractual risk omitted from dashboard summaries, as the SB Energy filing illustrates.
Trade coverage, subcontractor backlog concentration, and key-person dependencies visible in payroll and procurement records can reveal exposures that have not reached the risk register. The purpose is to identify the labor assumptions behind the plan. A coverage review can then examine a known dependency before its effects are recast as an unexplained productivity loss.
The Linde Group case shows how detection also depends on the review process itself. Its traditional safety audit process took a great deal of experts’ time, and the quality of the audits varied. Redesigning that process for agent-first operation produced a reported dramatic reduction in audit reporting time, with consistency and coverage providing value beyond speed. A review process must reliably examine evidence that a fatigued reviewer might otherwise skip.
Rebuilding the process so honest disclosure is the path of least resistance
If surfacing a problem still brings an immediate penalty while silent absorption remains safe, independent evidence will expose recurring gaps without removing their cause. The structural fix is to make early disclosure less costly than concealment. That requires treating a quantified early risk as a planning input. Once the same exposure reaches the claim stage, that planning opportunity has become a liability.
The prerequisite is a process audit. Operations leaders should trace how information moves from field conditions to dashboard status, identify where it is filtered, and establish why each filter exists. That analysis distinguishes missing evidence from incentives that suppress available evidence. Embedded agents can then pull procurement data, track schedule quality trends, and flag critical-path compression without having to rely on optimistic summaries. Their role is part of the operational workflow, rather than an additional reporting layer after the fact.
A specific, painful process provides a practical starting point. The schedule update cycle, procurement tracking workflow, or subcontractor coverage review gives the redesign a defined operational purpose. Rebuilding one of these processes can produce a working change faster than a platform strategy, while testing whether evidence actually reaches planning decisions. The objective is a live process. Its defining test is whether the person who first recognizes a risk has less reason to absorb it silently than to make it visible.